
Facts and Figures
The division managed significant enrollment numbers and conducted a volume of advising sessions that reflected the unit’s critical teaching role, assisting students in DUS as well as undergraduates throughout the system who needed help in exploring academic opportunities and customizing their educations.
Enrollment Reports
- "Enrollment Reports" document the total number of students enrolled in DUS at University Park as well as across the Penn State system, including their semester standing, race/ethnicity, and numbers/percentages of Schreyer Scholars and student-athletes.
Where Are They Now? 2008 Cohort
- “Where Are They Now?” examines students’ paths following their enrollment in the Division of Undergraduate Studies. Data reflect the academic strength and persistence of DUS students and show that following their DUS experience, more than 95 percent of former division students remained in their chosen colleges/majors.
Advising Sessions
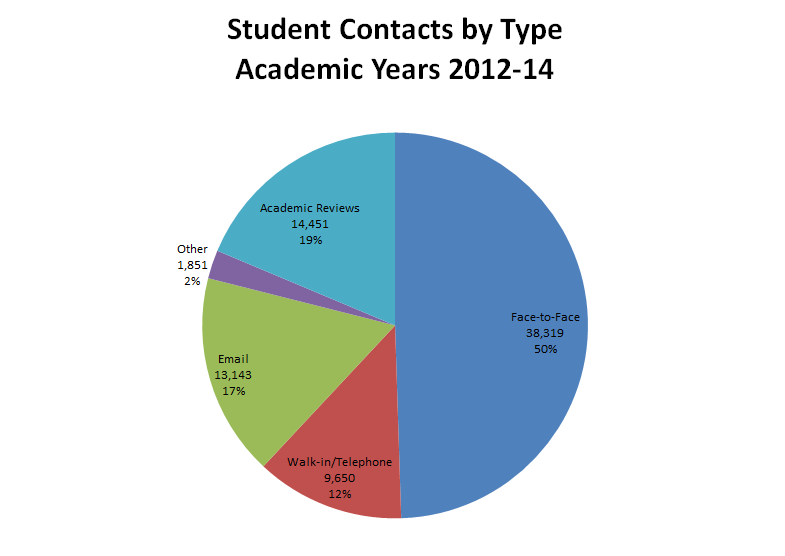
During this reporting period, Division of Undergraduate Studies advisers at University Park recorded 77,414 * advising sessions with undergraduate students via scheduled appointments, walk-in/quick-question advising, emails, and telephone calls. DUS advisers recorded 38,889 advising contacts in the 2012–2013 academic year and 38,525 contacts in the 2013–2014 academic year. Of these, 18,791 contacts were with students enrolled in colleges other than DUS.
The subsections below highlight key areas in which DUS provided exemplary guidance to students seeking advising assistance. (Click on graphs to see larger views.)
* may include multiple contacts with the same student
Overall Student Contacts
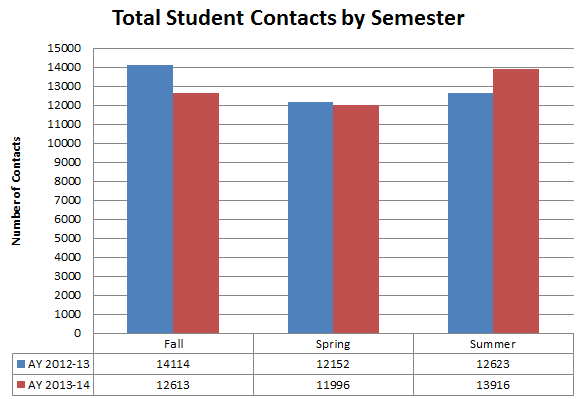
During the last two academic years, the Division of Undergraduate Studies recorded an average of 12,902 * advising contacts per semester. As illustrated below, advising demands were consistent throughout the year with little reduction in activity across semesters.
* may include multiple contacts with the same student
Walk-In Advising
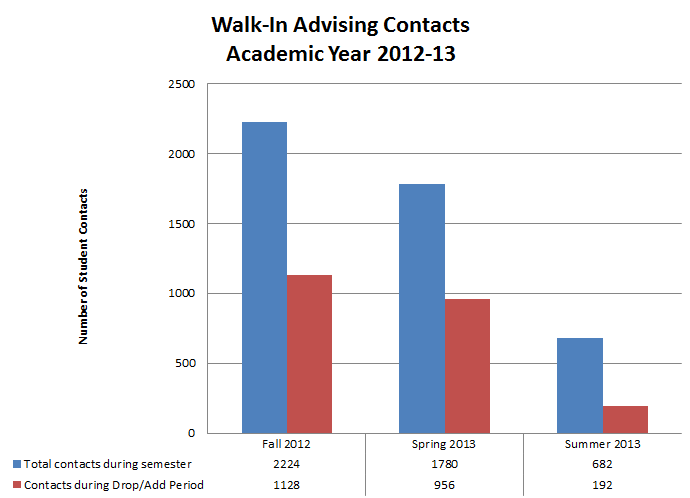
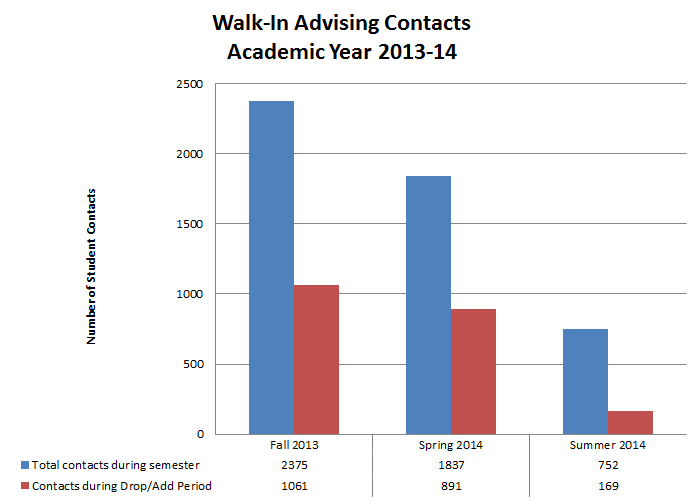
During the 2012–2013 academic year, DUS advisers assisted 4,686 students during walk-in advising sessions. This number represents students enrolled in the division as well as students in colleges across the system and parents with questions about current or prospective student enrollments at Penn State. In Academic Year 2013-14, DUS had contact with a total of 4,964 students during walk-in/quick-question advising.
Walk-in advising needs increase significantly during drop/add period every semester. The charts below illustrate the volume of advising sessions recorded during the drop/add period compared to the total number of walk-in students seen each semester.
Proactive Outreach via Academic Reviews
Division of Undergraduate Studies advisers additionally provide written, detailed academic reviews every semester for each student enrolled in DUS. Academic reviews include assessments of the student’s goals, academic progress, and future schedules as well as recommendations and referrals. DUS advisers conducted 6,860 academic reviews for the 2012–2013 academic year and 7,591 in 2013–2014. These reviews represent advising assistance above and beyond traditional appointments, email communications, and walk-in advising sessions.
Academic Consultations at New Student Orientation
Summary
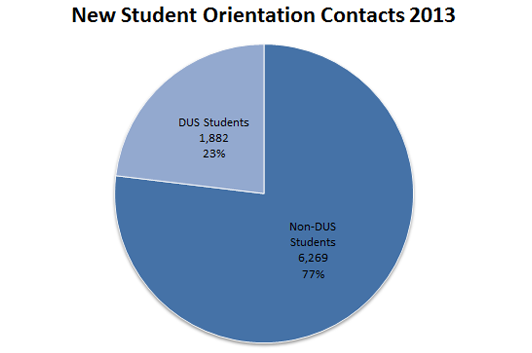
During summer 2013, DUS advisers provided educational and advising assistance to 8,151 incoming first-year students attending New Student Orientation (NSO). Of these contacts, 1,882 represent students enrolled in DUS and 6,269 reflect those enrolled in other colleges across University Park.
During summer 2014, DUS advisers assisted 8,488 incoming first-year students attending NSO; of these, 2,119 students were enrolled in DUS and 6,369 students were enrolled in other colleges.

2014 NSO Details
At University Park campus, 8,488 students met one-on-one with an academic adviser to discuss their academic plans and their decision to enroll in a particular college at University Park. Students were offered the choice of a brief discussion to confirm their plans or a more in-depth discussion that allowed for changes in plans or additional discussion topics.
- 1381 of these students initiated an in-depth discussion (16.3% of all attendees), with 23 of those students seeking multiple in-depth conversations during their NSO Day 2 visit.
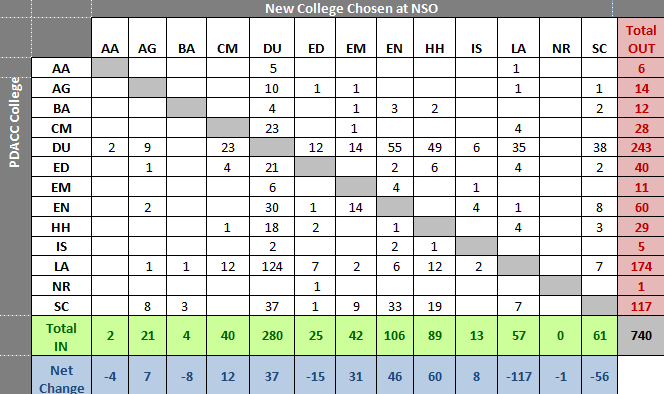
- 740 students made a change of college (8.7% of all attendees, 53.6% of all students seeking an in-depth discussion).
Net College Changes During NSO
Many more students than last year left Liberal Arts. The biggest reason for these students’ departure was an interest in majors in the Smeal College of Business. Thus, the vast majority of students leaving Liberal Arts transferred into DUS.
More students left DUS for the College of Engineering than any other college, with Health and Human Development being a close second. These changes were due primarily to identification of majors within those colleges as primary interest.
| College | 2010 | 2011 | 2012 | 2013 | 2014 |
|---|---|---|---|---|---|
| Arts & Architecture | -6 | -4 | 1 | -3 | -4 |
| Agricultural Sciences | 5 | -4 | 15 | 1 | 7 |
| Business | -7 | -1 | -7 | -13 | -8 |
| Communications | 24 | 9 | 27 | 27 | 12 |
| Division of Undergraduate Studies | -4 | 109 | -12 | -28 | 37 |
| Education | -8 | -29 | -3 | -14 | -15 |
| Earth and Mineral Sciences | 14 | 14 | 21 | 27 | 31 |
| Engineering | 21 | 13 | 31 | 27 | 46 |
| Health and Human Development | 50 | 53 | 50 | 93 | 60 |
| Information Sciences and Technology | 10 | 8 | 7 | 7 | 8 |
| Liberal Arts | -10 | -92 | -70 | -52 | -117 |
| Nursing | 0 | -1 | -1 | -1 | -1 |
| Science | -89 | -75 | -57 | -71 | -56 |
Reasons for Changes into/out of DUS
| Reason | 2010 | 2011 | 2012 | 2013 | 2014 |
|---|---|---|---|---|---|
| Undecided (exploring multiple colleges); entered DUS | 144 | 178 | 148 | 119 | 151 |
| Decided on Smeal; entered DUS | 64 | 88 | 97 | 103 | 113 |
| Decided but did not qualify for change; entered DUS | 15 | 23 | 6 | 3 | 13 |
| Decided (exploring within one college); left DUS | 205 | 155 | 253 | 238 | 205 |
| Total changes | 267 | 266 | 217 | 259 | 249 |
College Change Details
Other In-Depth Conversations
641 of 1,381 students who sought an in-depth conversation made no change in their college of enrollment. This number was lower than last year but still above the long-term average of students who remained in their college following a discussion (740 students in 2013, 595 in 2012, and 421 in 2011). This average increase, particularly during the last two years, is due in part to larger class sizes. Additional assessment is needed to determine what impact a slightly different style of introducing the change discussions had on the numbers of students seeking in-depth conversations.