
Facts and Figures
The division managed significant enrollment numbers and conducted a volume of advising sessions that reflected the unit’s critical teaching role, assisting students in DUS as well as undergraduates throughout the system who needed help in exploring academic opportunities and customizing their educations.
Enrollment Reports
- "Enrollment Reports" document the total number of students enrolled in DUS at University Park as well as across the Penn State system, including their semester standing, race/ethnicity, and numbers/percentages of Schreyer Scholars and student-athletes.
Advising Sessions
During this reporting period (fall 2014, spring 2015, and summer 2015), Division of Undergraduate Studies advisers at University Park recorded 41,775 * advising sessions with undergraduate students via scheduled appointments, walk-in/quick-question advising, emails, and telephone calls. Of these, 8,780 contacts were with students enrolled in colleges other than DUS.
The subsections below highlight key areas in which DUS provided exemplary guidance to students seeking advising assistance. (Click on graphs to see larger views.)
* may include multiple contacts with the same student
Overall Student Contacts
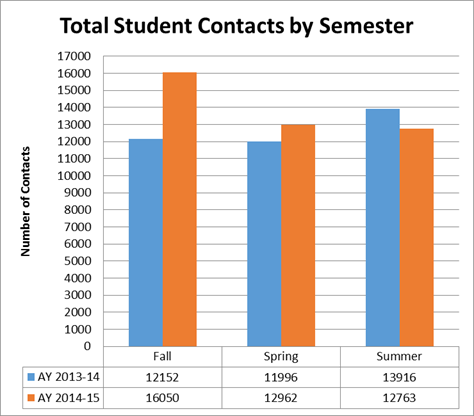
During the past academic year, the Division of Undergraduate Studies recorded an average of 13,925 * advising contacts per semester. As illustrated below, advising demands were consistent throughout the year with little reduction in activity across semesters.
* may include multiple contacts with the same student
Walk-In Advising
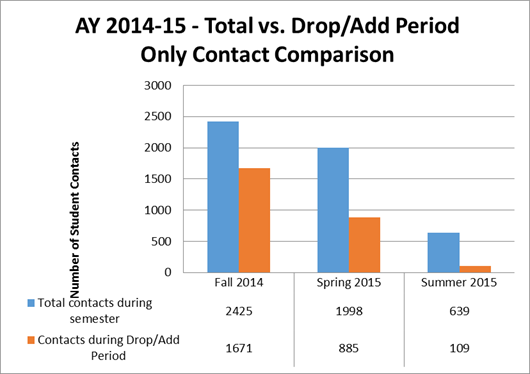
During the 2014–2015 academic year, DUS advisers assisted 5,062 students during walk-in advising sessions. This number represents students enrolled in the division as well as students in colleges across the system and parents with questions about current or prospective student enrollments at Penn State.
Walk-in advising needs increase significantly during drop/add period every semester. The charts below illustrate the volume of advising sessions recorded during the drop/add period compared to the total number of walk-in students seen each semester.
Proactive Outreach via Academic Reviews
Division of Undergraduate Studies advisers provide written, detailed academic reviews every semester for each student enrolled in DUS. Academic reviews include assessments of the student’s goals, academic progress, and future schedules as well as recommendations and referrals. DUS advisers conducted 6,369 academic reviews for the 2014–2015 academic year. These reviews represent advising assistance above and beyond traditional appointments, email communications, and walk-in advising sessions.
Academic Consultations at New Student Orientation
Summary
During summer 2015, DUS advisers provided educational and advising assistance to 7,713 incoming first-year students attending New Student Orientation (NSO). Of these contacts, 1,989 represent students enrolled in DUS and 5,724 reflect those enrolled in other colleges across University Park.
2015 NSO Details
At University Park campus, 7,713 students met one-on-one with an academic adviser to discuss their academic plans and their decision to enroll in a particular college at University Park. Students were offered the choice of a brief discussion to confirm their plans or a more in-depth discussion that allowed for changes in plans or additional discussion topics.
- 1306 of these students initiated an in-depth discussion (16.9% of all attendees), with 42 of those students seeking multiple in-depth conversations during their NSO Day 2 visit.
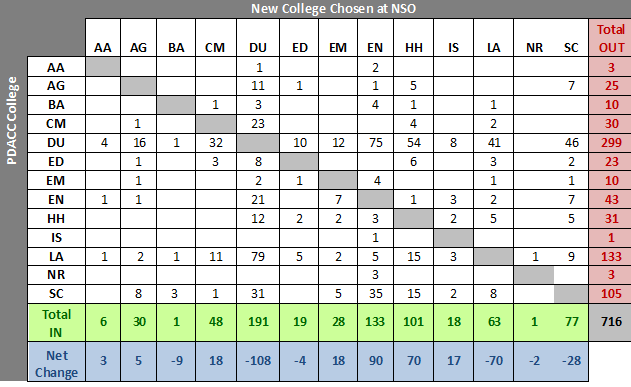
- 716 students made a change of college (9.3% of all attendees, 54.8% of all students seeking an in-depth discussion).
Net College Changes During NSO
There were significant differences in student change patterns this year. Notably, DUS saw a net departure of 108 students during the course of the summer. The majority of students departed DUS for the College of Engineering. This contributed to Engineering being the biggest “change-in” college during NSO. Health and Human Development, another traditional large gain college, was in second place for the first time in many years. The biggest gain for DUS was from Liberal Arts students seeking business goals. Other notes included a slight increase for Arts and Architecture, due to BARCH and LARCH being open all summer, and the first ever change into NURS, which was briefly open this summer.
| College | 2011 | 2012 | 2013 | 2014 | 2015 |
|---|---|---|---|---|---|
| Arts & Architecture | -4 | 1 | -3 | -4 | 3 |
| Agricultural Sciences | -4 | 15 | 1 | 7 | 5 |
| Business | -1 | -7 | -13 | -8 | -9 |
| Communications | 9 | 27 | 27 | 12 | 18 |
| Division of Undergraduate Studies | 109 | -12 | -28 | 37 | -108 |
| Education | -29 | -3 | -14 | -15 | -4 |
| Earth and Mineral Sciences | 14 | 21 | 27 | 31 | 18 |
| Engineering | 13 | 31 | 27 | 46 | 90 |
| Health and Human Development | 53 | 50 | 93 | 60 | 70 |
| Information Sciences and Technology | 8 | 7 | 7 | 8 | 17 |
| Liberal Arts | -92 | -70 | -52 | -117 | -70 |
| Nursing | -1 | -1 | -1 | -1 | -2 |
| Science | -75 | -57 | -71 | -56 | -28 |
Reasons for Changes into/out of DUS
| Reason | 2011 | 2012 | 2013 | 2014 | 2015 |
|---|---|---|---|---|---|
| Undecided (exploring multiple colleges); entered DUS | 178 | 148 | 119 | 151 | 106 |
| Decided on Smeal; entered DUS | 88 | 97 | 103 | 113 | 82 |
| Decided but did not qualify for change; entered DUS | 23 | 6 | 3 | 13 | 3 |
| Decided (exploring within one college); left DUS | 155 | 253 | 238 | 205 | 299 |
| Total changes | 266 | 217 | 259 | 249 | 344 |
College Change Details
Other In-Depth Conversations
590 students who sought an in-depth conversation made no change in their college of enrollment. This number was lower than last year, and is extremely close to the long-term average (641 students in 2014, 740 students in 2013, 595 in 2012, 421 in 2011). The continued decrease in this number is likely due to the slightly smaller class size and due to the increased number of students who made a change, which was nearly 9% of those attending NSO.